Examples
First Steps
Once py4DSTEM has been succsesfully installed, you can start using it in Python the usual way. The most popular way is using Jupyter Notebooks, but py4DSTEM can be run in python scripts, iPython, spyder, etc.
Your first py4DSTEM script
 1# Import the needed packages
 2import py4DSTEM
 3
 4# This line displays the current version of py4DSTEM:
 5py4DSTEM.__version__
 6
 7# download the dataset
 8py4DSTEM.io.download_file_from_google_drive(
 9    '1PmbCYosA1eYydWmmZebvf6uon9k_5g_S',
10    'simulatedAuNanoplatelet_binned.h5'
11)
12file_data = "simulatedAuNanoplatelet_binned.h5"
13
14# Load the data
15datacube = py4DSTEM.io.read(
16    file_data,
17    data_id = 'polyAu_4DSTEM'     # The file above has several blocks of data inside
18)
19
20# plot a diffraction pattern
21py4DSTEM.show(
22    datacube[10,30],
23    intensity_range='absolute',
24    vmin=20,
25    vmax=200,
26    cmap='viridis',
27)
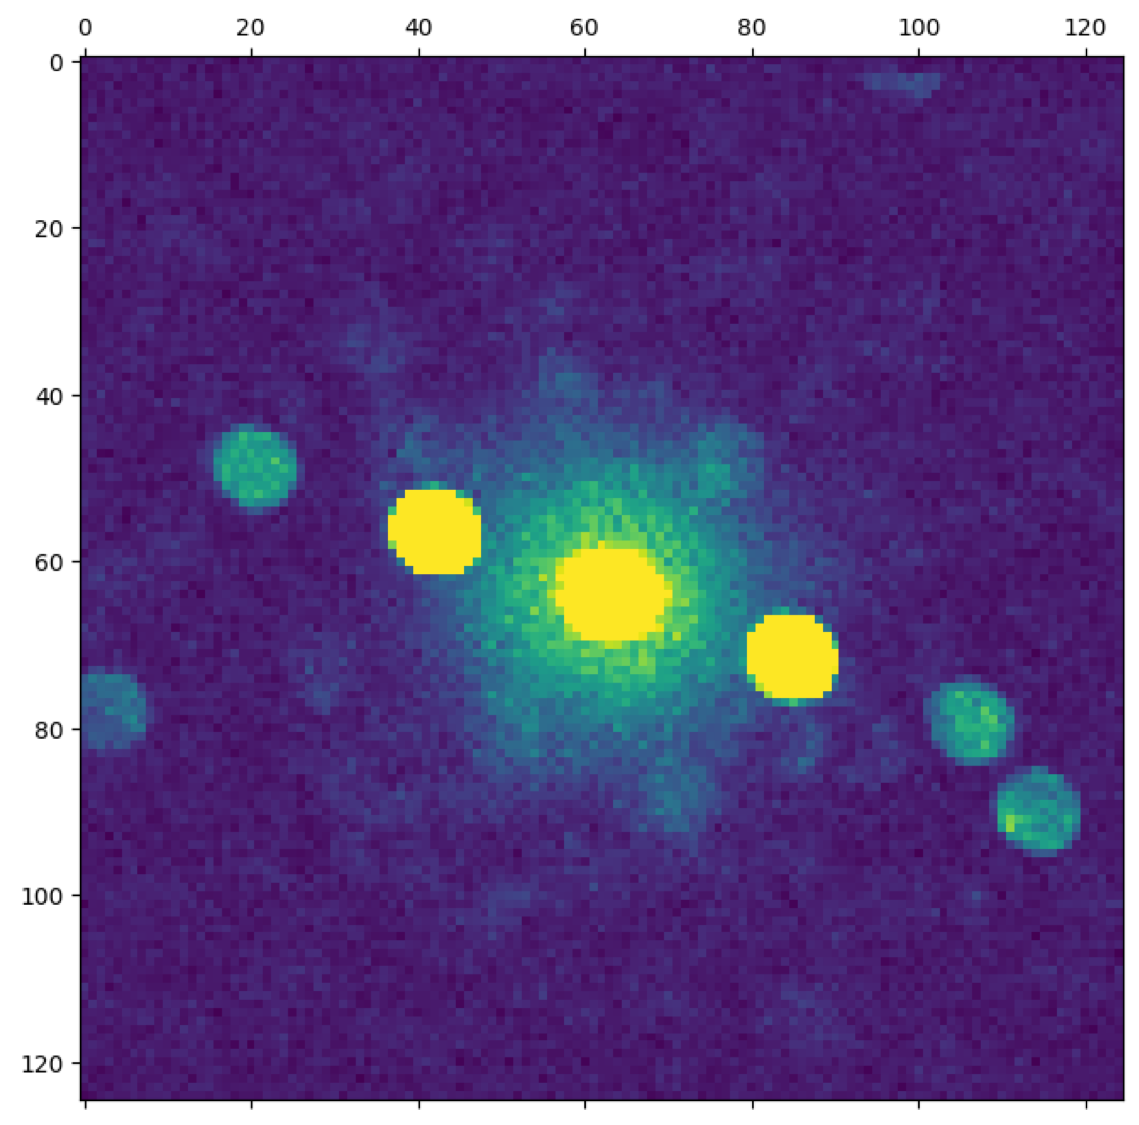
Congratulations you’ve just plotted your first diffraction pattern.
If you run into trouble, refer back to the installation instructions Installation. Remember to make sure you’ve activated the right Python environment.
Next Steps
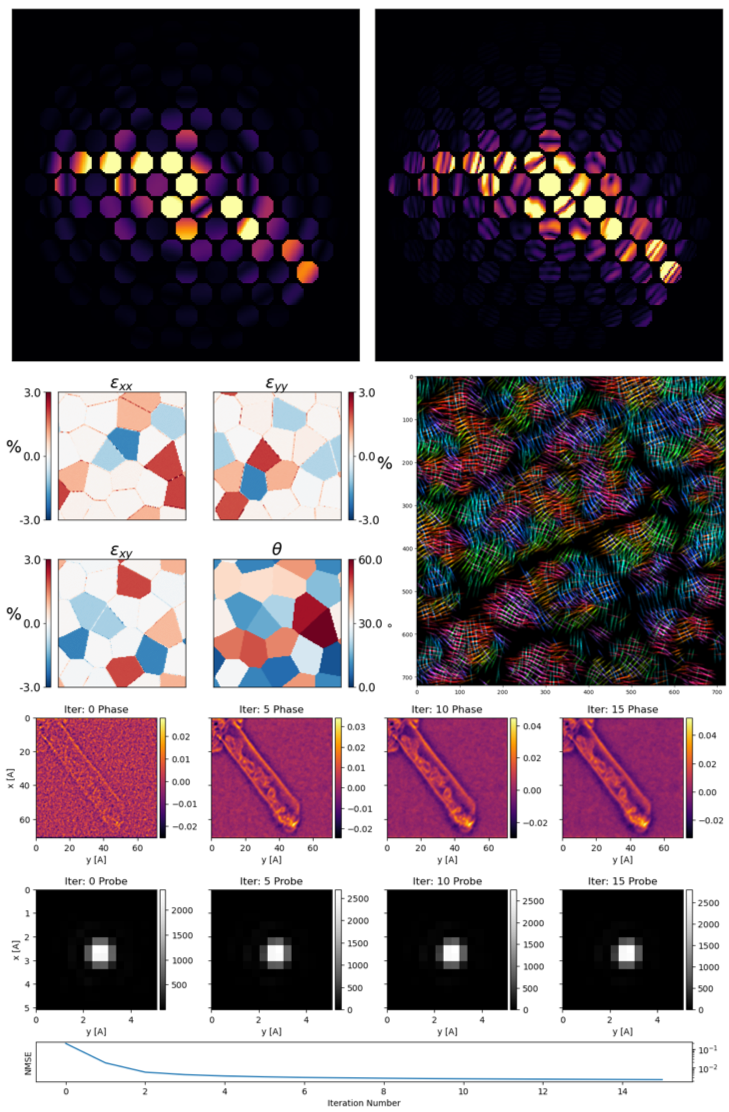
For a more extensive overview checkout the tutorial github repository to see example notebooks demonstraing the features of py4DSTEM. These can be downloaded and run locally or run through the browser using binder. Here are some example plots from different anaylses you’ll learn running the tutorials.